
For your green transport transformation,
we supply the GX infrastructure.
From vehicle-direct measurement (DTG) to ISO 14083 calculation, reporting, and assetization — the data infrastructure behind the green transport service transformation (GX). Accuracy proven across 1,800 KOLAS-accredited test runs.
Receive the emissions of purchased transport as measured data, not estimation factors — one path through industry-specific compliance.
Browse by industry →From one haul to a shipper’s carbon.
From Busan New Port to an inland logistics center — one paid haul is observed, segmented, and settled into reporting boundaries.
The commercial relationship
- Origin
- Busan New Port, Terminal A
- Chain
- Prime → agency → owner-driver
- Status
- Paid transport
The spatial segment
- Leg
- Port access road → Namhae Expressway
- Distance
- 18.4 km (example)
- Data
- GPS-measured format · values are examples
Paid-leg separation
- Prime contract leg
- 42.0 km (example)
- Agency dispatch leg
- 31.6 km (example)
- Double-counted
- 0 km (example)
OWN = the reporter’s direct legs · SUBTREE = the view including sub-networks
The result and its basis
- Leg emissions
- 46.8 kgCO₂e (example)
- Calculation
- distance × vehicle-type factor × load condition
- Grade
- AI estimate (example)
What gets verified is the basis, not the headline number.
Where the transformation starts —
carbon read directly from the vehicle.
A carbon tachograph that plugs straight into the OBD-II port in five minutes. It measures driving, fuel, and emissions every second — with accuracy proven across 1,800 KOLAS-accredited test runs.
Measured values become the report.
Deterministic calculation under ISO 14083 with Korean corrections — same inputs, same result years later. A preview reproducing the real product screen; all figures are examples.
HQ Supply-chain Carbon Analysis
| Group | Total (tCO₂e) | Wtd. EI (gCO₂e/tkm) | Count |
|---|---|---|---|
| Road | 12.34 | 68.5 | 128 |
| Sea | 45.67 | 9.2 | 34 |
| Rail | 3.21 | 24.1 | 12 |
| Air | 8.90 | 610.3 | 6 |
A preview reproducing the actual product screen’s structure and labels. All figures are illustrative.
Your shippers have started asking for carbon on every shipment.
Average factors inflate your footprint as if every empty return leg carried a full load. The DTG measures each trip at 1-second resolution, strips out empty runs, and counts only what you actually hauled — numbers you can hand your shippers as-is.

- 01
Why now
Shippers now ask for carbon per shipment, not an annual total. An answer filled with average factors collapses under the follow-up question: “is this measured?” The demand has already started, and it is beginning to appear in contracts and tenders.
- 02
What’s broken
The problem is that the data is scattered across the field. Fuel use per vehicle, cargo weight, empty and return-leg distance, actual distance driven — the moment a shipper asks, none of it is organized anywhere. Average factors inflate precisely because they fill that gap “as if” the load were there.
- 03
How it’s measured
The DTG measures each trip at 1-second resolution. It identifies and removes empty return legs as they are, and feeds only the activity you actually carried into the ISO 14083 methodology. Numbers that begin with measurement, not estimation.
- 04
What you deliver
The result is per-shipment emissions you can hand your shippers as-is. The basis is sealed to measured activity data, so when a shipper asks you to verify, you return the same number.
We measure only your paid-transport share of a shared truck’s emissions.
When multiple shippers’ cargo rides on one truck, the emissions have to be split between them. We allocate the carrier’s measured data by ton-km so you get exactly your paid-transport share — Scope 3 that passes verification.

- 01
Why now
Most of your Scope 3 logistics emissions come from transport you outsourced. But that truck does not carry your freight alone. Take the whole footprint and you over-count; cut it arbitrarily and you have no basis — neither passes verification.
- 02
What’s broken
The crux is allocation. To split one trip’s emissions across shippers you need each cargo’s weight and distance — its ton-km. If that value lives only in the carrier’s field and never reaches you, your share cannot be calculated.
- 03
How it’s measured
LCS Cloud takes the carrier’s measured activity data and allocates it by ton-km. It splits the shares of multiple shippers on the same trip without double counting, and seals each allocation with a record_hash so you can trace “why this number.”
- 04
What you deliver
The result is your share of Scope 3 Category 4/9 emissions that passes verification. Because it is an allocation of measured activity data — not an arbitrary estimate — you can present a basis under audit and supply-chain due diligence.
For your safe transport transformation, we supply the AX infrastructure.
Harsh acceleration, braking, cornering — truck driving behavior (BBI) measured directly from the vehicle, backing the safe transport transformation with data. GX for carbon, AX for safety.
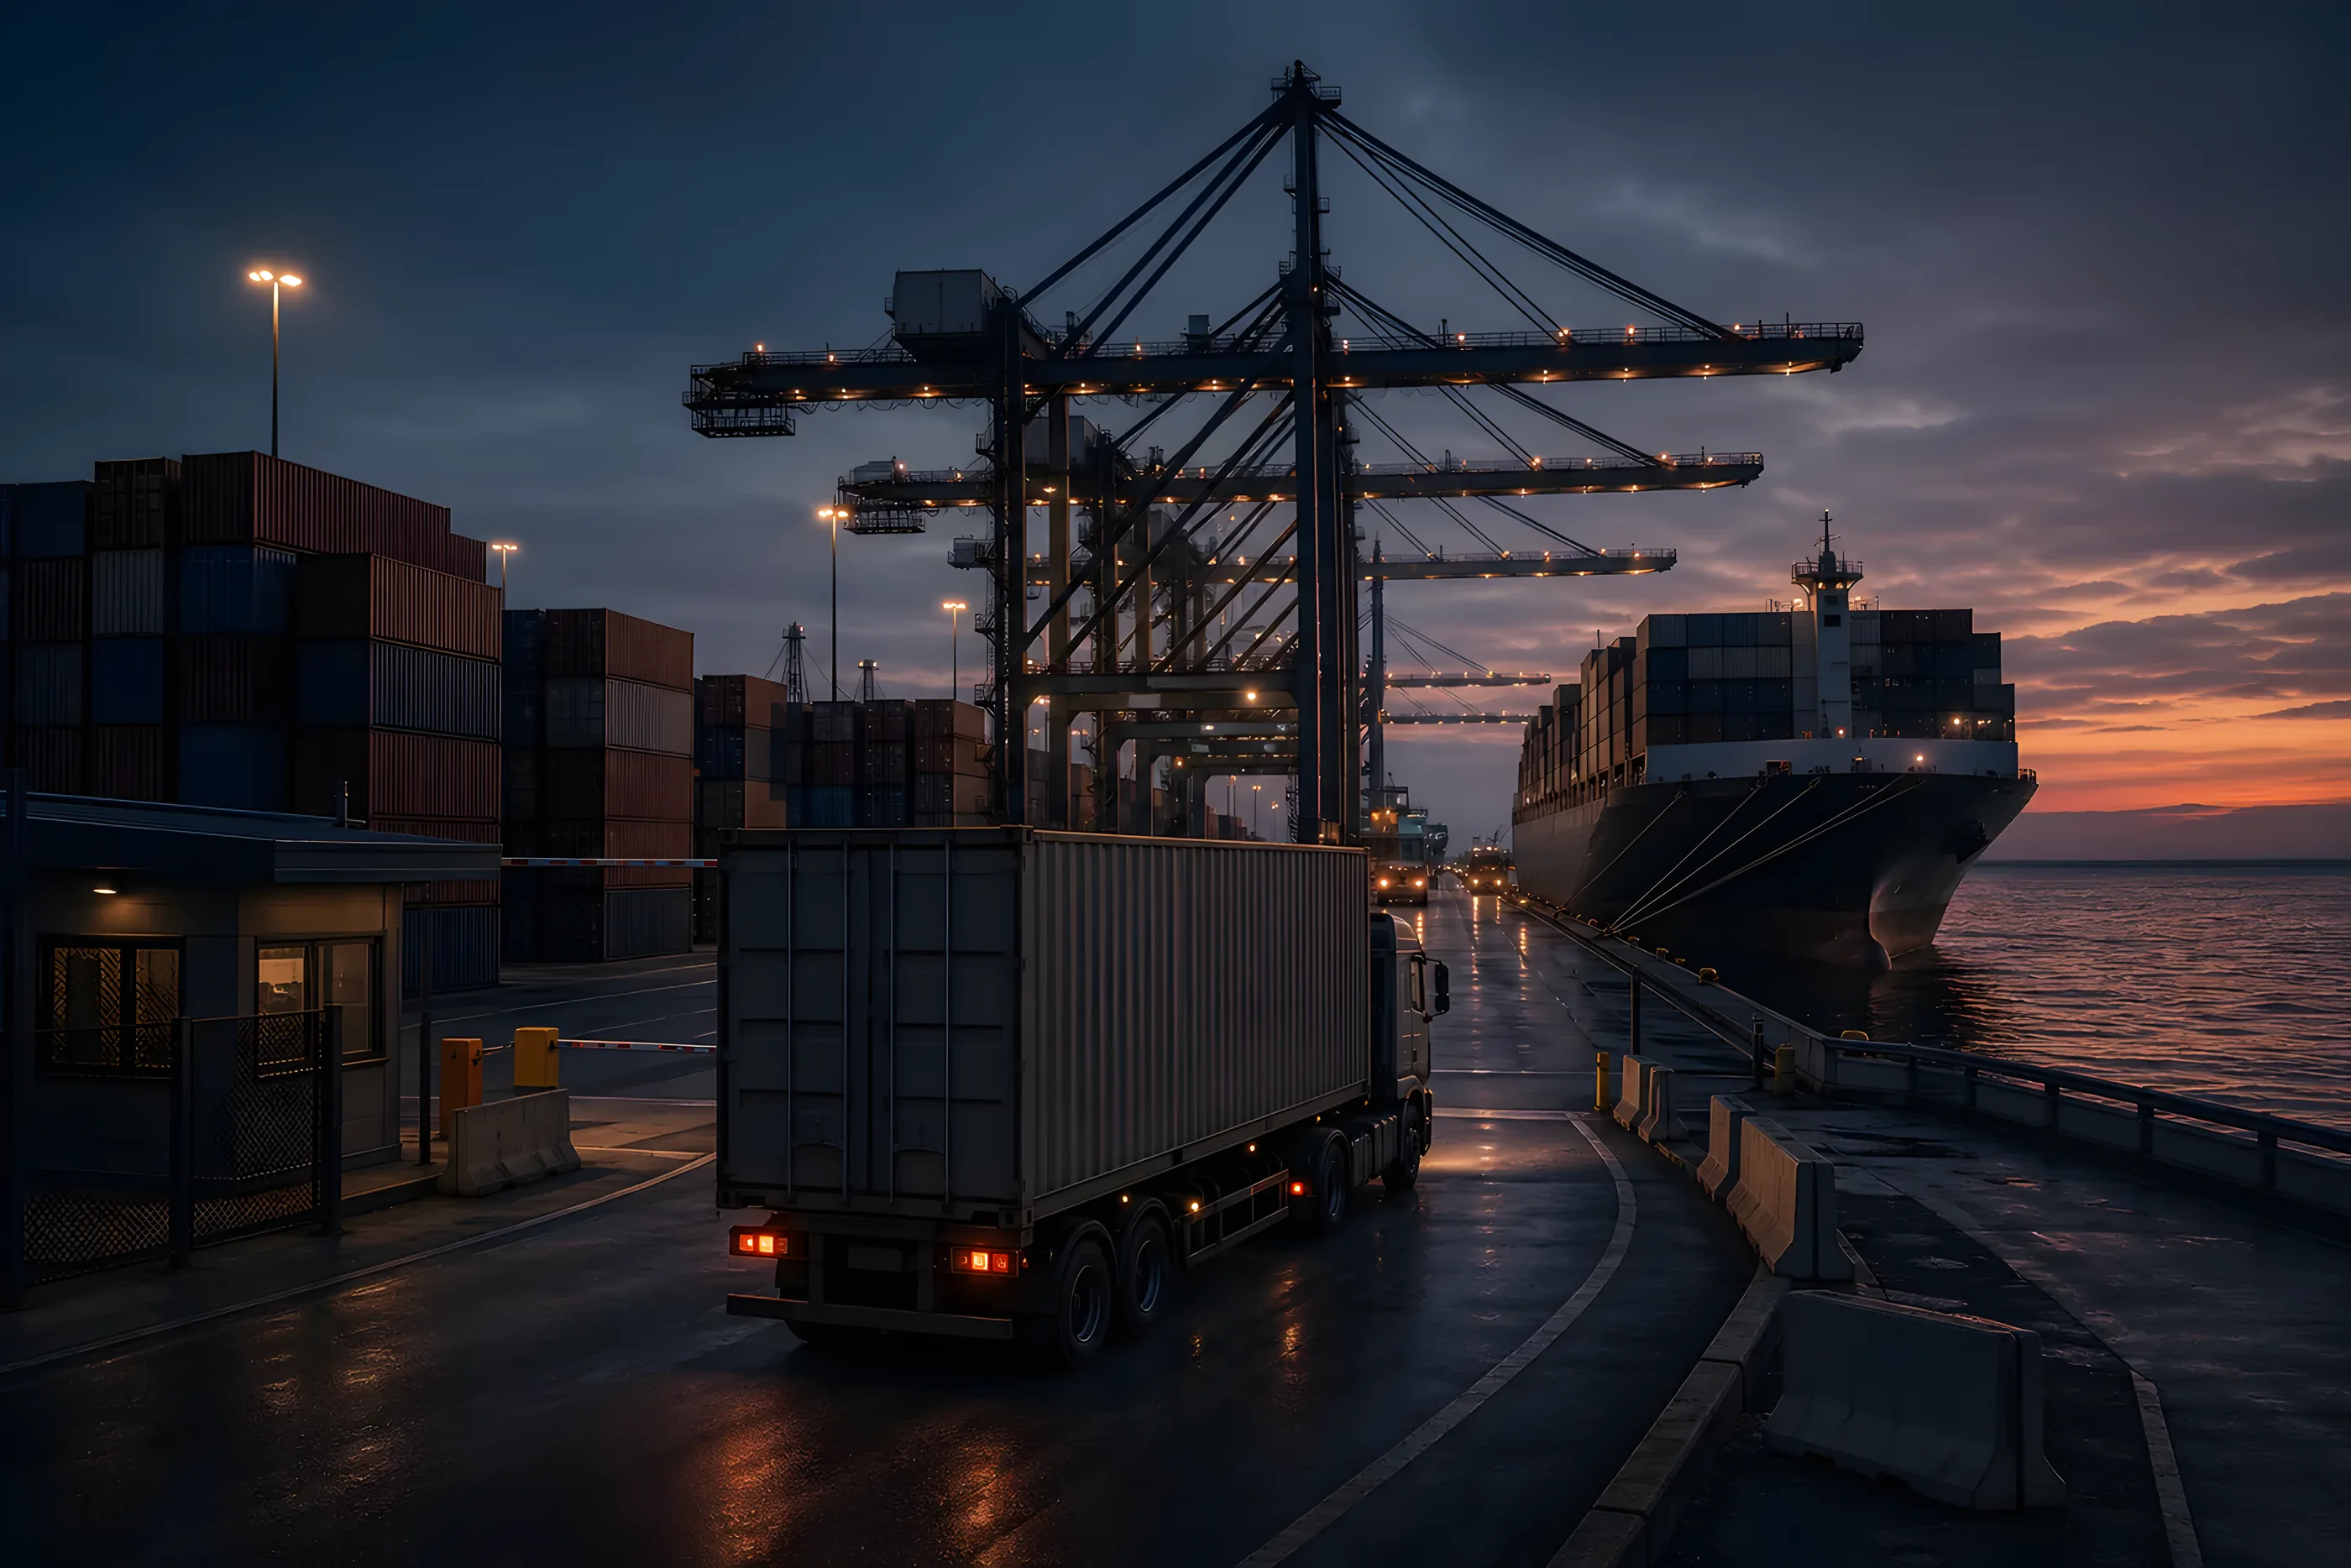
Export-import multimodal transport, measured precisely all the way to the final destination.
Road, terminal and sea in one export-import chain — even as the mode changes leg by leg, the paid-transport emissions your shippers report are measured without a break, all the way to the final destination.

EAC REVENUE SIMULATOR
If we switch our fleet to electric,
how much could we earn from carbon credits?
Enter your vehicle counts to see annual emissions reductions and estimated EAC revenue.
Carbon DTG is billed per measured vehicle (30); LCS SaaS per whole fleet (30). Lowering the measured share reduces only the DTG subscription — LCS SaaS stays.
※ Emission factors: CNG 3.21 kgCO₂e/Nm³ · electricity 0.58452 kgCO₂e/kWh (EcoTransIT World Korea). Truck and van consumption factors are estimated values based on public research (DEFRA and measured data). Revenue and pricing are illustrative estimates; actual transaction terms are negotiated. The passenger-car emissions comparison is approximate. LTS measures, verifies, and administers issuance; it is not the issuer. SFC verifies conformity with ISO-14083.
Measurement accuracy, proven by verification.
1,800 KOLAS-accredited test runs and SFC verification of ISO-14083 conformity — accuracy proven by documents issued by independent bodies.
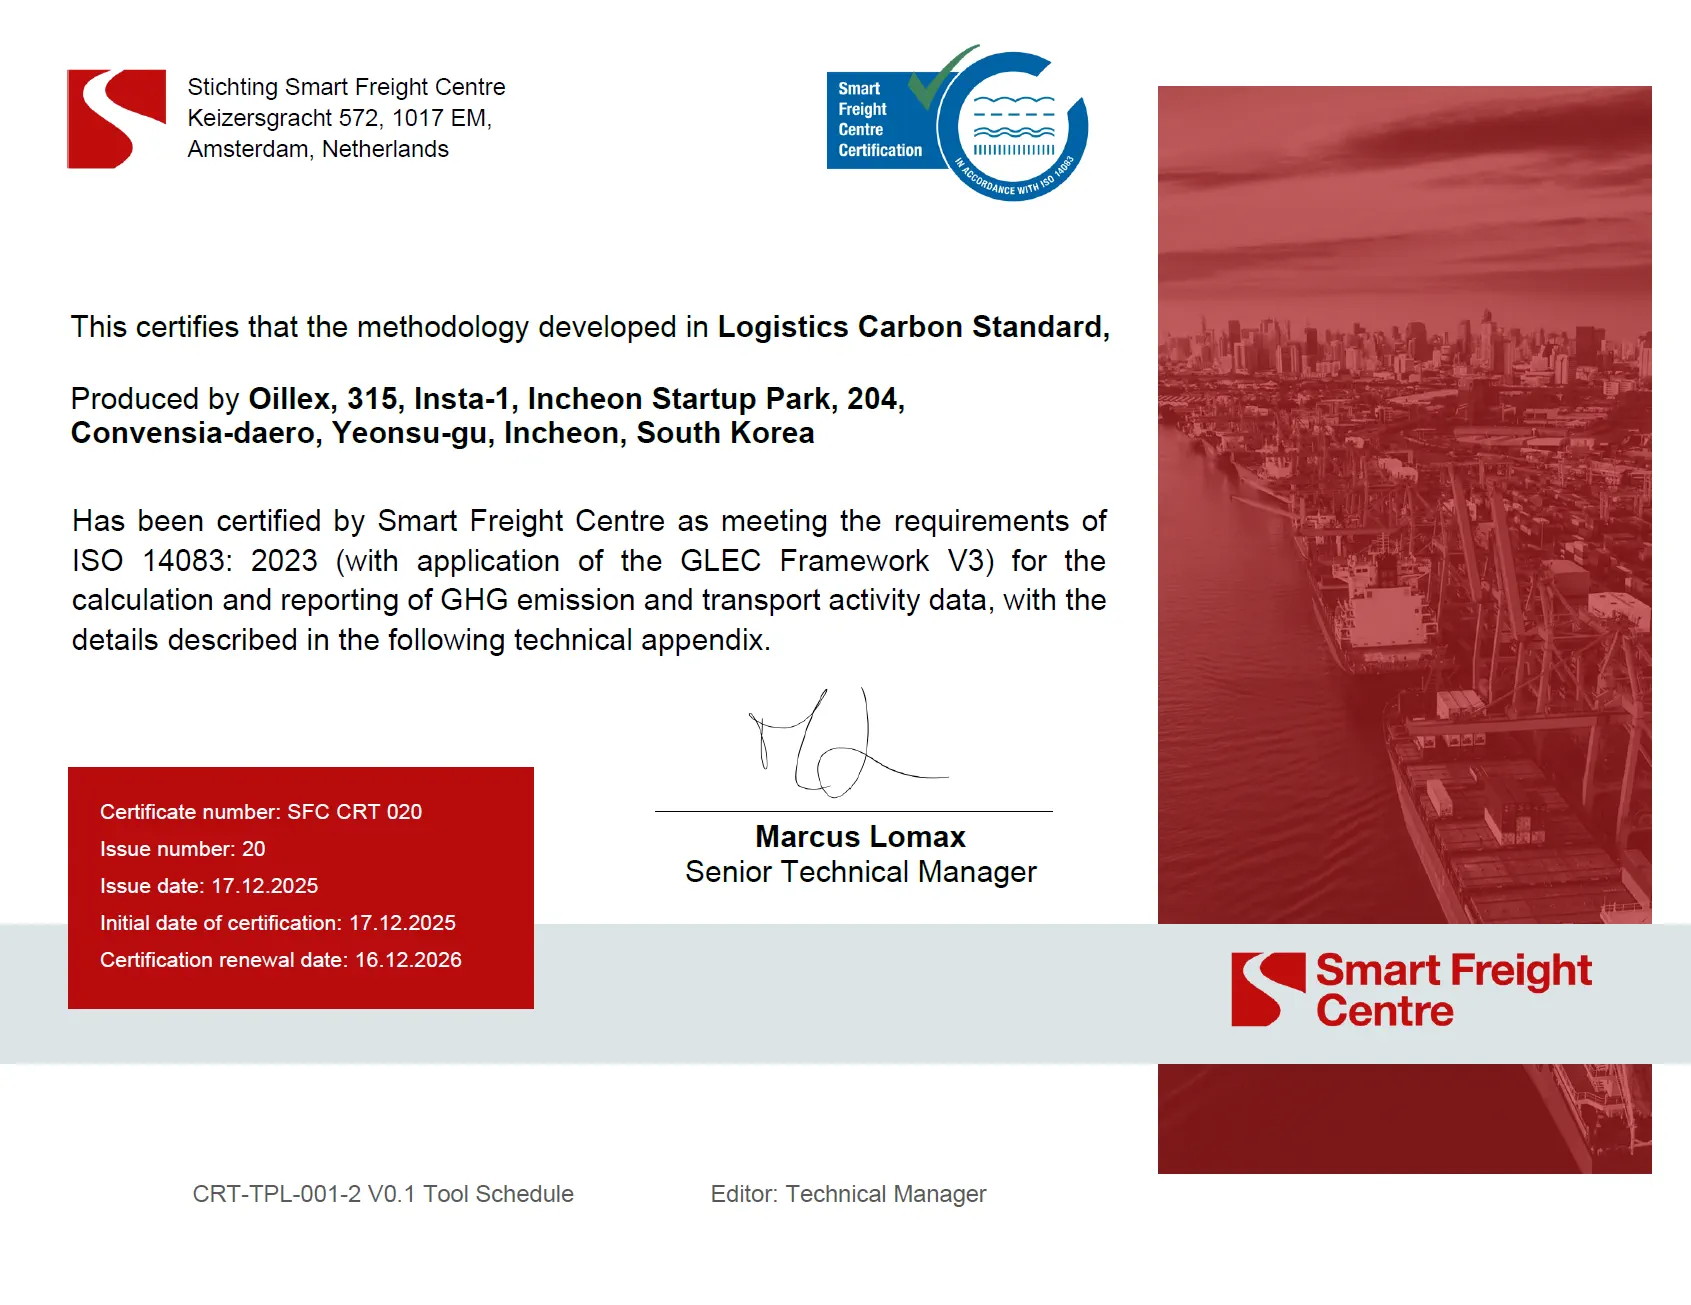
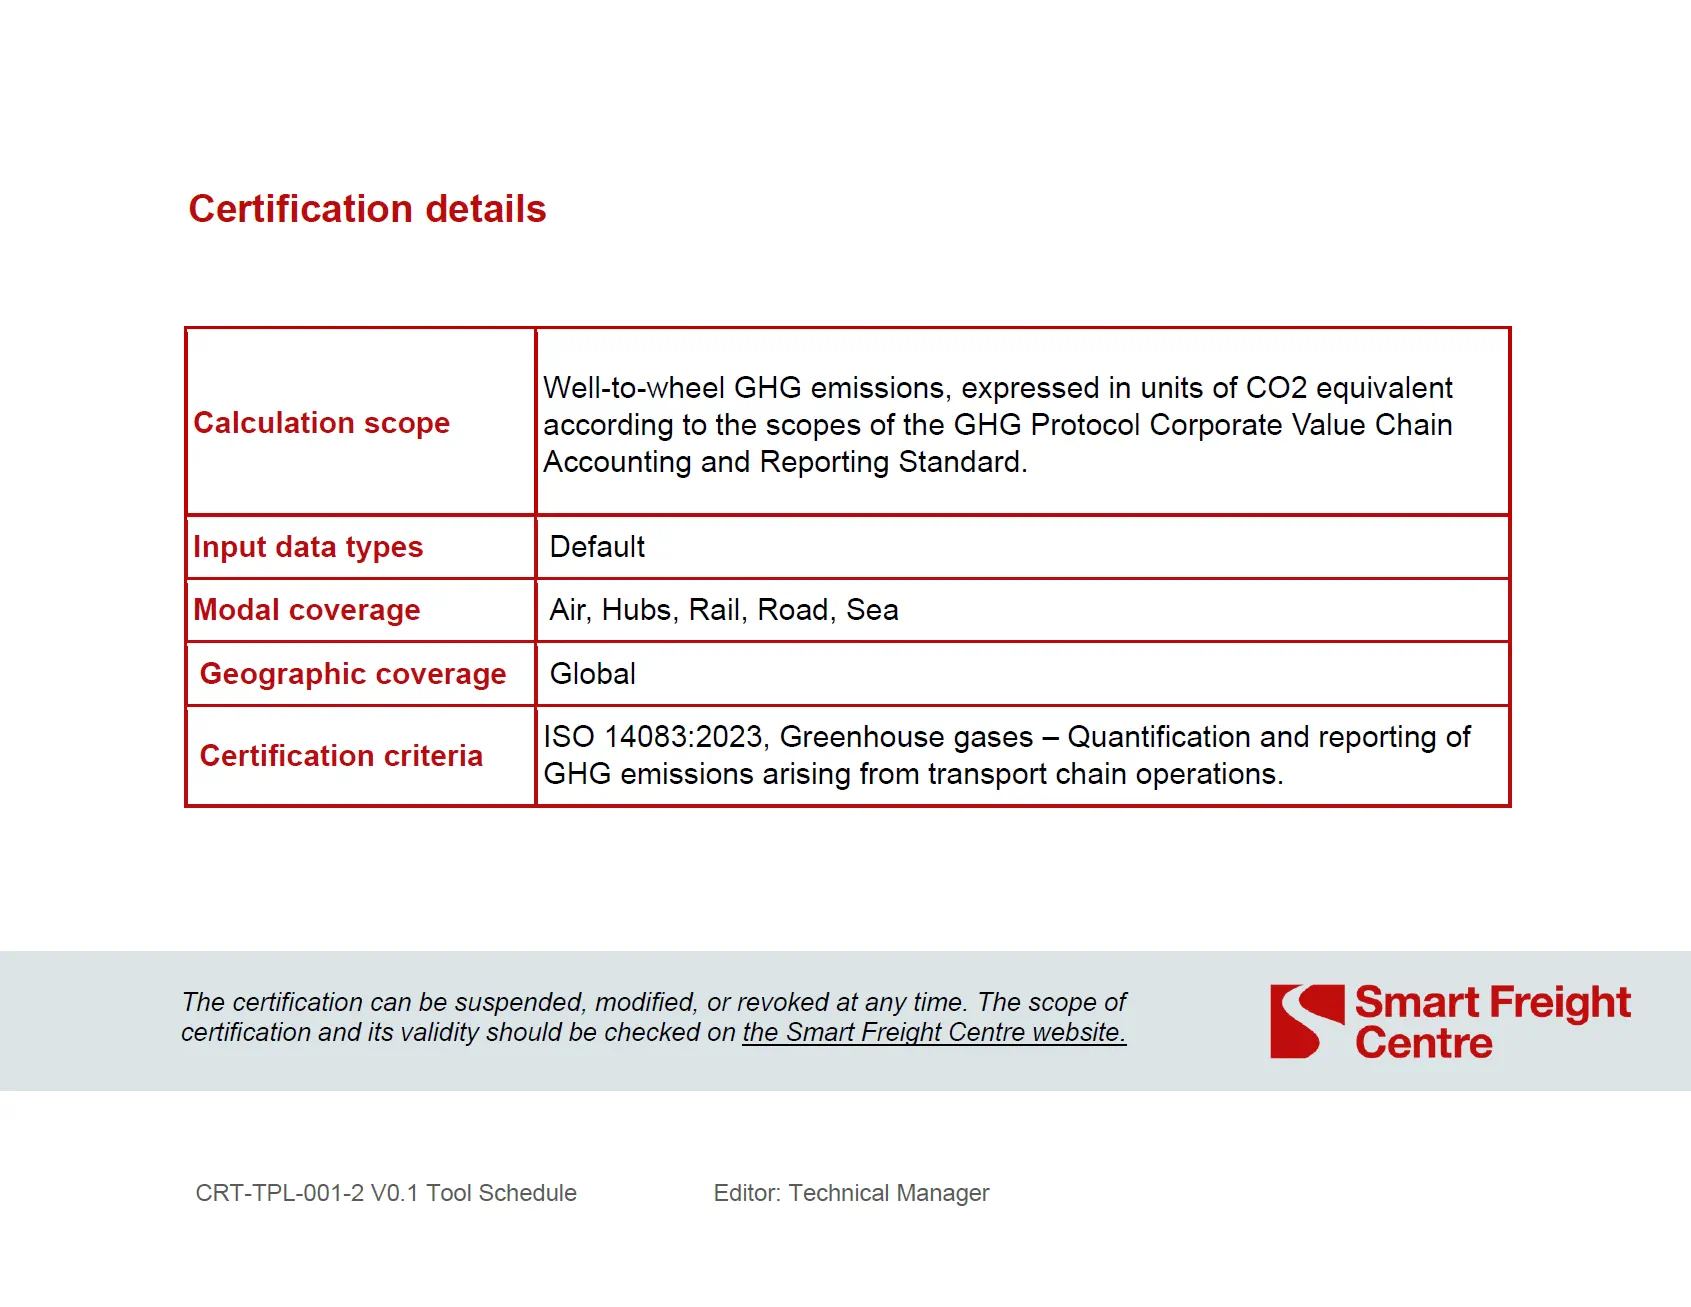


We read the standards ourselves and write about where the work gets stuck.
Each report is our own analysis, read from the primary sources. Quotations carry their source and page, and no figure appears that we could not confirm in the original.
Start from measurement.
We audit your current reporting and design the rollout order that fits your fleet.